- Home
- About Us
-
Consular Services
- Launch of e-Clearance for Afterlife Remains (eCARe) portal
- Instructions regarding entry into the consular Wing
- Reissue of International Driving Permit (IDP)
- Postal Applications
- Visa Services
- Passport Services
- OCI Information
- Renunciation of Indian Citizenship/Surrender Certificate
- Attestation,Consular and Misc.Services
- Weekly Open House
- MADAD - Consular Services Management System
- Indian Community Welfare Fund
- FAQs on Marital disputes involving NRI/PIO spouses

- Public Notices & Circulars
-
Embassy Wings
- Economic & Commercial Wing
- Contacts
- GI Digital Catalogue

- Overview of Indian Economy
- India-Germany Economic & Commercial Relations
- Doing Business in India
- Make in India
- Invest India
- Flagship Programs of Government of India
- Doing Business in Germany
- Trade Fairs
- Trade Dispute Advisory
- Foreign Investment
- Foreign Trade
- Newsletters
- Attestation of Documents
- Community Welfare
- Culture
- Information Wing/Media Center
- Science & Technology
- Political
- Consular
- Defence Wing
- Economic & Commercial Wing
- Media Center
- India-Germany Relations
- MIIM
- Useful Links
- Tenders
Monthly Economic Report
Department of Economic Affairs
Economic Division
4(3)/Ec. Dn. /2012
MONTHLY ECONOMIC REPORT
DECEMBER 2016
*****
HIGHLIGHTS
- As per the first revised estimates of national income, consumption expenditure, savings and capital formation, released by the Central Statistics Office (CSO) on January 31, 2017, growth rate of Gross Domestic Product (GDP) at constant market prices is placed 7.9 per cent in 2015-16 and 7.2 per cent in 2014-15. The first advance estimates of national income released on 6th January 2017, based on information for the first seven to eight months of the current financial year, estimated that the growth of GDP for the year 2016-17 will be 7.1 per cent.
- The growth in Gross Value Added (GVA) at constant (2011-12) basic prices for the year 2016-17 is estimated to be 7.0 per cent (as per 1st advance estimate), as compared to 7.8 per cent in 2015-16 (first revised estimates). At the sectoral level, agriculture, industry and services sectors grew at the rate of 4.1 per cent, 5.2 per cent and 8.8 per cent respectively in 2016-17.
- Stocks of foodgrains (rice and wheat) held by FCI as on January 1, 2017 was 43.4 million tonnes, compared to 49.8 million tonnes as on January 1, 2016.
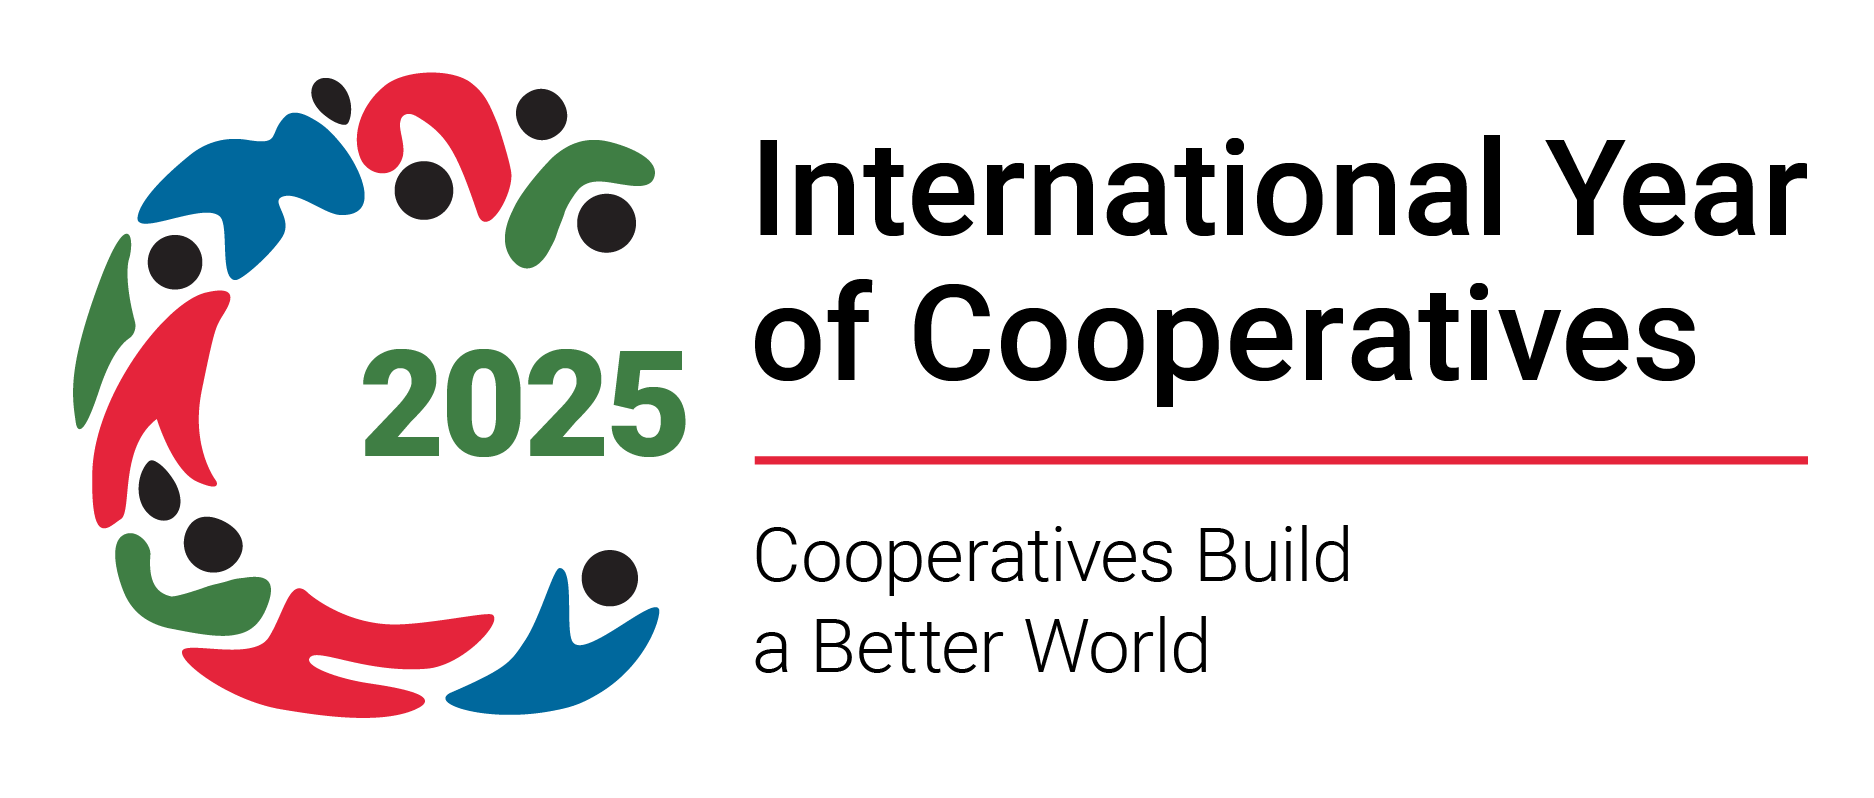
- The Index of Industrial Production (IIP) grew by 5.7 per cent in November 2016, as compared to a contraction of 3.4 per cent in November 2015. The IIP growth during April-November 2016-17 was 0.4 per cent, as compared to 3.8 per cent during the corresponding period of previous year.
- Eight core infrastructure industries grew by 5.6 per cent in December 2016, as compared to 2.9 per cent in December 2015. The growth of these industries during April-December 2016-17 was 5.0 per cent, as compared to 2.6 per cent during the corresponding period of previous year.
- Growth of money supply on year on year (YoY) basis as of 23rd December 2016 stood at 6.5 per cent, as compared to a growth rate of 10.9 per cent recorded on the corresponding date in the previous year.
- Merchandise exports and imports increased by 5.7 per cent and 0.5 per cent respectively in US dollar terms in December 2016 over December 2015. During December 2016, oil imports increased by 14.6 per cent and non-oil imports declined by 3.0 per cent respectively over December 2015. During April-December 2016, merchandise exports increased by 0.8 per cent, while imports declined by 7.4 per cent.
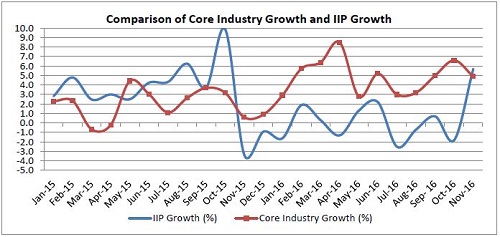
- Foreign exchange reserves stood at US$ 360.3 billion as on 30th December 2016, as compared to US$ 360.2 billion at end March 2016. The rupee depreciated against the US dollar and Pound sterling by 0.4 per cent and 0.8 per cent respectively, while it appreciated against Japanese Yen and Euro by 7.0 per cent, and 2.2 per cent respectively, in December 2016 over November 2016.
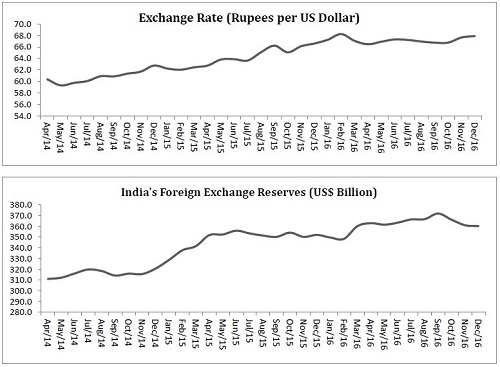
- The WPI headline inflation declined to 3.4 per cent in December 2016 from 3.6 per cent in November 2016. CPI (New Series) inflation increased to 3.4 per cent in December 2016 from 3.2 per cent in November 2016.
- Gross tax revenue during April-December 2016-17 recorded a growth of 18.3 per cent over April-December 2015-16. Tax revenue (net to Centre) increased by 20.9 per cent during April-December 2016-17. The budget estimate of the fiscal deficit as per cent of GDP at current market price for 2017-18 has been set at 3.2 per cent, as compared to 3.5 per cent in 2016-17(RE).
(Narendra Jena)
Economic Officer
jena.narendra@nic.in
1.ECONOMIC GROWTH
- As per the first revised estimates of national income, consumption expenditure, savings and capital formation, released by the Central Statistics Office (CSO) on January 31, 2017, growth rate of Gross Domestic Product (GDP) at constant market prices is placed 7.9 per cent in 2015-16 and 7.2 per cent in 2014-15. The first advance estimates of national income released on 6th January 2017, based on information for the first seven to eight months of the current financial year, estimated that the growth of GDP for the year 2016-17 will be at 7.1 per cent.
- The growth in Gross Value Added (GVA) at constant (2011-12) basic prices for the year 2016-17 is estimated to be 7.0 per cent (as per 1st advance estimate), as compared to 7.8 per cent in 2015-16 (first revised estimates). At the sectoral level, agriculture, industry and services sectors grew at the rate of 4.1 per cent, 5.2 per cent and 8.8 per cent respectively in 2016-17.
- The share of total final consumption in GDP at current prices in 2016-17 was at 71.3 per cent((as per 1st advance estimate) as compared to 68.1 per cent (1st revised estimate) in 2015- 16.The fixed investment rate ratio of gross fixed capital formation to GDP) declined from 29.2 per cent(1st revised estimate) in 2015-16 to 26.6 per cent (as per 1st advance estimate)in 2016-17.
- The saving rate (ratio of gross saving to GDP) for the years 2015-16 was 32.2 per cent, as compared to 33.0 per cent in 2014-15. The investment rate (rate of gross capital formation to GDP) in 2015-16 was 33.2 per cent, as compared to 34.2 per cent in 2014-15.
2.AGRICULTURE AND FOOD MANAGEMENT
- Rainfall: The cumulative rainfall received for the country as a whole, during the period 1st January – 18th January, 2017, has been 1 per cent above normal. The actual rainfall received during this period has been 10.6 mm as against the normal of 10.5 mm. Out of the total 36 meteorological subdivisions, 3 subdivisions received large excess rainfall, 1 subdivision received excess rainfall, 2 subdivisions received normal rainfall, 4 subdivisions received deficient rainfall,17 subdivisions received large deficient rainfall and the remaining 4 subdivisions received no rainfall.
- All India production of food grains: As per the 1st Advance Estimates (AE) released by Ministry of Agriculture & Farmers Welfare on 22nd September 2016, production of kharif food grains during 2016-17 is estimated at 135.0 million tonnes (Table 3), as compared to 124.1 million tonnes in 2015-16 (1st AE).
- Procurement: Procurement of rice as on 17th January, 2016 was 24.9 million tonnes during Kharif Marketing Season 2016-17 whereas procurement of wheat was 23.0 million tonnes during Rabi Marketing Season 2016-17 (Table 4).
- Off-take: Off-take of rice during the month of November, 2016 was 29.5 lakh tonnes. This comprises 27.1 lakh tonnes under TPDS/NFSA and 2.4 lakh tonnes under other schemes. In respect of wheat, the total off-take was 23.4 lakh tonnes comprising 17.8 lakh tonnes under TPDS/NFSA and 5.6 lakh tonnes under other schemes. The cumulative off-take of food grains during 2016-17 (till November, 2016) is 45.6 million tonnes (Table 5).
- Stocks: Stocks of food-grains (rice and wheat) held by FCI as on 1st January, 2017 was 43.4 million tones, as compared to 49.8 million tonnes as on 1st January, 2016 (Table 6).
3.INDUSTRY AND INFRASTRUCTURE
Index of Industrial Production (IIP)
- The growth rate of overall IIP in November 2016 was 5.7 per cent with robost growth in all sub sectors. During April-November 2016, the IIP growth was 0.4 per cent, as compared to the growth of 3.8 per cent during the corresponding period of previous year.
- The mining sector grew at 3.9 per cent in November 2016, as compared to 1.7 per cent growth in November 2015 due to higher production of coal, crude oil and natural gas sectors. The manufacturing production registered strong growth of 5.5 per cent in November 2016 as compared to a contraction of 4.6 per cent growth in the corresponding month of previous year. However, during April-November, 2016, this sector recorded a contraction of 0.3 per cent as compared to a growth of 3.9 per cent during the corresponding period of previous year.
- In terms of use based classification, all sub-sectors namely basic goods, intermedi ber 2016. Capital goods production increased by 15 per cent in November 2016, as ate goods, capital goods and consumer goods have registered positive growth in Novem compared to a huge contraction of 24.4 per cent in the corresponding month of the previous year.
Eight Core Industries
- Eight Core industries registered a growth of 5.6 per cent in December 2016 as compared to 2.9 per cent in December 2015. During April-December, 2016, the growth of the core industries was 5.0 per cent, as compared to the growth of 2.6 per cent during the corresponding period of previous year.
- Coal production increased by 4.4 per cent in December 2016 as compared to 5.3 per cent growth in December 2015.
- Crude oil contracted by 0.8 per cent in December 2016 while natural gas production showed nill growth. Refinery production increased by 6.4 per cent in December 2016 as compared to 2.1 per cent during the corresponding month of previous year.
- Fertilizers production contracted by 4.7 per cent growth while steel production grew by 14.9 per cent in December 2016.
Some Infrastructure Indicators
- The number of telephone subscribers in India increased from 1,103 million at the end of October 2016 to 1,124 million at the end of November 2016. The overall tele-density in India stood at 87.8 per hundred individuals at end November 2016; the urban tele-density was 164.4 and rural tele-density was 52.9.
- The traffic handled in major ports grew by 7.5 per cent, to 481.2 million tonnes in April-December 2016 from 447.4 million tonnes in the corresponding period of previous year.
- Power Sector Scenario
- As per the Central Electricity Authority, electricity generation grew by 6.1 per cent in December 2016. Growth of electricity generation was 5.2 per cent during April-December 2016
- The addition to power generation capacity was 7423.0 MW during April-December 2016, as compared to 11226.0 MW during April-December 2015. During 2015-16, the addition to power generation capacity was 23,977 MW, as compared to 22,566 MW during the previous year.
- The total installed capacity for electricity generation was 310005 MW at the end of December 2016, of which the share of thermal, hydro, renewable and nuclear sources was 69.4 per cent, 13.9 per cent , 14.8 per cent and 1.9 per cent respectively.
4.FINANCIAL MARKETS
Money and Banking
- Money Supply: Growth of Money Supply on year on year (YoY) basis as of 23rd December 2016 stood at 6.5 per cent as compared to a growth rate of 10.7 per cent recorded in the corresponding period in the previous year. As regards the components of money supply, the growth of ‘currency with the public’ registered decline of 47.8 per cent as of 23rd December 2016 against growth of 13.1 per cent registered during the corresponding period a year ago. The growth rate of time deposits with banks was 13.6 per cent as of 23rd December 2016 as against 10.3 per cent in recorded in the corresponding period a year ago. On the other hand, demand deposits increased by 27.1 per cent as of 23rd December 2016 as against 10.6 per cent during the same period last year. The details of sources of money supply are given in the Table 9.
- Growth of Deposits, Credit and Investments by Scheduled Commercial Banks (SCBs): Growth of aggregate deposits of Scheduled Commercial Banks (SCBs) as 23rd December 2016 was 15.2 per cent on YoY basis as compared to 10.2 per cent recorded during the corresponding period of the previous year. In terms of bank credit, YoY growth was 5.1 per cent as of 23rd December 2016 as against 10.6 per cent in the corresponding period a year ago. The YoY growth of investment in Government and other approved securities by SCBs was 34.6 per cent as of 23rd December 2016 as compared to 10.6 per cent in the corresponding period of the previous year.
- The base lending rate as of 23rd December 2016 was 9.30/9.65 per cent as compared to 9.30/9.70 per cent during the corresponding period a year ago. The term deposit rates for above one year was 6.50/7.00 per cent as of 23rd December 2016 as against 7.00/7.90 per cent during the corresponding period a year ago.
Lending and deposit rates
5.EXTERNAL SECTOR
- Foreign trade: Merchandise exports and imports increased by 5.7 per cent and 0.5 per cent respectively in US dollar terms in December 2016 over December 2015. During December 2016, oil imports increased by 14.6 per cent and non-oil imports declined by 3.0 per cent respectively over December 2015. During April-December 2016, merchandise exports increased by 0.8 per cent, while imports declined by 7.4 per cent (Table 10).
- Balance of Payments: India’s balance of payments situation has been benign and comfortable since 2013-14 and this continued through the first half (H1) of 2016-17. India’s current account deficit (CAD) was lower at US$ 3.7 billion (0.3 per cent of GDP) in H1 of 2016-17, as compared to US$ 14.7 billion (1.5 per cent of GDP) in H1 of 2015-16. Net invisibles were lower at US$ 45.7 billion in H1 of 2016-17 as against US$ 56.7 billion in H1 of 2015-16. The net capital inflows declined to 1.8 per cent of GDP during H1 of 2016-17, as against 2.5 per cent of GDP during H1 of 2015-16.
- Foreign Exchange Reserves:Foreign exchange reserves stood at US$ 360.3 billion as on 30th December 2016, as compared to US$ 360.2 billion at end March 2016 (Table 11).
- Exchange Rate: The rupee depreciated against the US dollar and Pound sterling by 0.4 per cent and 0.8 per cent respectively, while it appreciated against Japanese Yen and Euro by 7.0 per cent, 2.2 per cent respectively, in December 2016 over the previous month of November 2016 (Table 12).
- External Debt: India’s external debt stood at US$ 484.3 billion at end-September 2016, recording a decline of 0.2 per cent over the level at end-March 2016. Long-term debt was US$ 403.1 billion at end-September 2016 as compared to US$ 401.7 billion at end-March 2016. Short-term external debt was US$ 81.2 billion at end-September 2016, as compared to US$ 83.4 billion at end-March 2016.
6.INFLATION
- The Inflation based on Consumer Price Indices (CPI): The all India CPI inflation (New Series-Combined) eased to 3.4 per cent in December 2016 from 3.6 per cent in November 2016 mainly on account of fall in food inflation. Food inflation based on Consumer Food Price Index (CFPI) declined to 1.4 per cent in December 2016 from 2.0 per cent in November 2016 on account of fall in inflation in vegetables, egg, meat & fish, pulses & products, sugar & confectionary and spices. CPI Fuel & light inflation increased to 3.8 per cent in December 2016 from 2.8 per cent in the previous month.
- Inflation based on CPI-IW for October 2016 declined to 3.3 per cent from 4.1 per cent in the previous month. Inflation based on CPI-AL and CPI-RL stood at 2.9 per cent and 3.0 per cent respectively in November 2016 (Table 16).
- Wholesale Price Index (WPI): The headline WPI inflation increased to 3.4 per cent in December 2016 from 3.2 per cent in November 2016. WPI food inflation (food articles + food products) declined to 2.8 per cent in December 2016 from 4.4 per cent in the previous month mainly on account of ‘fruits & vegetables’, pulses and ‘egg, meat & fish’. Inflation in Fuel & power increased to 8.7 per cent in December 2016 from 7.1 per cent in the previous month. Inflation for manufactured products and non-food manufactured products (core) increased to 3.7 per cent and 2.2 per cent respectively in December 2016 as compared to 3.2 per cent and 1.6 per cent in the previous month.
- Global Commodity Prices (based on the World Bank Pink Sheet data): Food inflation based on World Bank Food index declined marginally to 8.2 per cent in December 2016 from 8.3 per cent in November 2016. Energy prices as measured by the World Bank energy index increased by 43 per cent (YoY) and ‘metals & minerals’ increased by 30.4 per cent in December 2016 (Table 15).
7.PUBLIC FINANCE
- The budget estimate of the fiscal deficit as per cent of GDP at current market price for 2017-18 has been set at 3.2 per cent, as compared to 3.5 per cent in 2016-17(RE). The Budget estimate for revenue deficit as per cent of GDP at current market price for 2017-18 is 1.9 per cent, as compared to 2.1 per cent in 2016-17(RE).
- The growth in figures for 2017-18 BE over 2016-17 RE are as follows:
- Gross tax revenue for 2017-18 BE is Rs. 19,11,579 crore, recording a growth of 12.2 per cent over 2016-17 RE.
- Revenue Receipts (net to Centre) increased by 6.5 per cent in 2017-18 BE over 2016-17 RE to Rs. 15,15,771 crore.
- Tax revenue (net to Centre) increased to Rs. 12,27,014 crore a growth of 12.7 per cent over 2016-17 RE.
- Non-tax revenue of Rs. 2,88,757 crore, declined by 13.7 per cent
- Total expenditure amounting Rs. 21,46,735 crore, increased by 6.6 per cent over 2016-17 RE.
- While Revenue Expenditure increased by 5.9 per cent in 2017-18 BE, Capital Expenditure increased by 10.7 per cent over 2016-17 RE.
8.SOME MAJOR ECONOMIC DECISIONS IN DECEMBER 2016
- The Union Cabinet approved the development of Pune Metro Rail Project Phase – 1. The Pune Metro Rail Corridor will be covering a length of 31.3 km.
- The Cabinet Committee on Economic Affairs (CCEA) approved the proposal of half yearly review of Nutrient Based Subsidy rates for Phosphatic and Potassic fertilizers for the year 2016-17, in the interest of farmers.
- The Union Cabinet approved the proposal of Ministry of Shipping to replace the Major Port Trusts Act, 1963 by the Major Port Authorities Bill, 2016. This will empower the major ports with autonomy in decision making and by modernizing their institutional structure.
- The Union Cabinet approved the Cadre review and formation of a new service by the name of Índian Enterprise Development Service (IEDS)’ in the Office of Development Commissioner (MSME). The creation of the new cadre and change in structure will strengthen the organization and help to achieve the vision of “Startup India”, “Stand-up India” and “Make in India”.
- The Cabinet Committee on Economic Affairs approved for doubling of Rajpura-Bhatinda railway line at an estimated cost of Rs.1,251.3 crore and expected completion cost of Rs.1,465.6 crore.
- To promote digital payment methods and to encourage consumers and merchants to increasingly shift to these payment modes, Government of India launched Lucky Grahak Yojana and Digi-Dhan Vyapar Yojana.
*****
TABLES
| Table 1: Growth of GVA at Basic Prices by Economic Activity at Constant (2011-12) Prices (in per cent) | ||||||
| Sectors | Growth Rate (%) | Share in GVA or GDP (%) | ||||
| 2014-15 2nd RE |
2015-16 1st RE |
2016-17 AE |
2014-15 2nd RE |
2015-16 1st RE |
2016-17 AE |
|
| Agriculture, forestry & fishing | -0.3 | 0.8 | 4.1 | 16.5 | 15.4 | 15.0 |
| Industry | 6.9 | 8.2 | 5.2 | 31.3 | 31.4 | 30.8 |
| Mining & quarrying | 14.7 | 12.3 | -1.8 | 3.2 | 3.3 | 2.8 |
| Manufacturing | 7.5 | 10.6 | 7.4 | 17.4 | 17.8 | 17.5 |
| Electricity, gas, water supply & other utility services |
7.2 | 5.1 | 6.5 | 2.2 | 2.1 | 2.2 |
| Construction | 3.0 | 2.8 | 2.9 | 8.5 | 8.1 | 8.2 |
| Services | 9.5 | 9.8 | 8.8 | 52.2 | 53.2 | 54.3 |
| Trade, Hotel, Transport Storage | 8.6 | 10.7 | 6.0 | 18.5 | 19.0 | 19.0 |
| Financial , real estate & prof servs | 11.1 | 10.8 | 9.0 | 21.3 | 21.9 | 22.0 |
| Public Administration, defence and other services |
8.6 | 10.7 | 6.0 | 18.5 | 19.0 | 19.0 |
| GVA at basic prices | 6.9 | 7.8 | 7.0 | 100.0 | 100.0 | 100.0 |
| GDP | 7.2 | 7.9 | 7.1 | --- | --- | --- |
| Source: Central Statistics Office (CSO). 2nd RE: Second Revised Estimates 1st RE: First Revised Estimates, AE: as per first advance estimates of GDP released on 6th January 2017. | ||||||
| Table 2: Quarter-wise Growth of GVA at Constant (2011-12) Basic Prices (per cent) | ||||||||||
| Sectors | 2014-15 | 2015-16 | 2016-17 | |||||||
| Q1 | Q2 | Q3 | Q4 | Q1 | Q2 | Q3 | Q4 | Q1 | Q2 | |
| Agriculture, forestry & fishing | 2.3 | 2.8 | -2.4 | -1.7 | 2.6 | 2.0 | -1.0 | 2.3 | 1.8 | 3.3 |
| Industry | 8.0 | 5.9 | 3.8 | 5.7 | 6.7 | 6.3 | 8.6 | 7.9 | 6.0 | 5.2 |
| Mining & quarrying | 16.5 | 7.0 | 9.1 | 10.1 | 8.5 | 5.0 | 7.1 | 8.6 | -0.4 | -1.5 |
| Manufacturing | 7.9 | 5.8 | 1.7 | 6.6 | 7.3 | 9.2 | 11.5 | 9.3 | 9.1 | 7.1 |
| Electricity, gas, water supply & other utility services |
10.2 | 8.8 | 8.8 | 4.4 | 4.0 | 7.5 | 5.6 | 9.3 | 9.4 | 3.5 |
| Construction | 5.0 | 5.3 | 4.9 | 2.6 | 5.6 | 0.8 | 4.6 | 4.5 | 1.5 | 3.5 |
| Services | 8.6 | 10.7 | 12.9 | 9.3 | 8.8 | 9.0 | 9.1 | 8.7 | 9.6 | 8.9 |
| Trade, hotels, transport, communication and services related to broadcasting |
11.6 | 8.4 | 6.2 | 13.1 | 10.0 | 6.7 | 9.2 | 9.9 | 8.1 | 7.1 |
| Financial, real estate & professional services |
8.5 | 12.7 | 12.1 | 9.0 | 9.3 | 11.9 | 10.5 | 9.1 | 9.4 | 8.2 |
| Public Administration, defence and other services |
4.2 | 10.3 | 25.3 | 4.1 | 5.9 | 6.9 | 7.2 | 6.4 | 12.3 | 12.5 |
| GVA at basic prices | 7.4 | 8.1 | 6.7 | 6.2 | 7.2 | 7.3 | 6.9 | 7.4 | 7.3 | 7.1 |
| GDP at market prices | 7.5 | 8.3 | 6.6 | 6.7 | 7.5 | 7.6 | 7.2 | 7.9 | 7.1 | 7.3 |
| Table 3: Production of Major Agricultural Crops (1st Adv. Est.) | ||||||
| Crops | Production (in Million Tonnes) | |||||
| 2012-13 | 2013-14 | 2014-15 | 2015-16 (4th AE) |
2016-17 (1st AE) |
||
| Total Foodgrains | 257.1 | 265.0 | 252.0 | 252.2 | 135.0 | |
| Rice | 105.2 | 106.7 | 105.5 | 104.3 | 93.9 | |
| Wheat | 93.5 | 95.9 | 86.5 | 93.5 | -- | |
| Total Coarse Cereals | 40.0 | 43.3 | 42.9 | 37.9 | 32.5 | |
| Total Pulses | 18.3 | 19.3 | 17.2 | 16.5 | 8.7 | |
| Total Oilseeds | 30.9 | 32.8 | 27.5 | 25.3 | 23.4 | |
| Sugarcane | 341.2 | 352.1 | 362.3 | 352.2 | 305.2 | |
| Cotton# | 34.2 | 35.9 | 34.8 | 30.1 | 32.1 | |
| Source: DES, DAC&FW, M/o Agriculture & Farmers Welfare. 1st AE: 1st Advance Estimates of Kharif crops only, 4th AE : Fourth Advance Estimates, # Million bales of 170 kgs. each. | ||||||
| Table 4 : Procurement of Crops in Million Tonnes | ||||||
| Crops | 2011-12 | 2012-13 | 2013-14 | 2014-15 | 2015-16 | 2016-17 |
| Rice# | 35.0 | 34.0 | 31.8 | 32.0 | 34.2 | 24.9$ |
| Wheat@ | 28.3 | 38.2 | 25.1 | 28.0 | 28.1 | 23.0$ |
| Total | 63.3 | 72.2 | 56.9 | 60.2 | 62.3 | 47.9 |
| # Kharif Marketing Season (October-September), @ Rabi Marketing Season (April-March), $ Position as on 17.01.2017 Source: DFPD, M/o Consumer Affairs and Public Distribution. | ||||||
| Table 5: Off-Take of Food Grains (Million Tonnes) | ||||||
| Crops | 2012-13 | 2013-14 | 2014-15 | 2015-16 | 2016-17 (Till November) |
|
| Rice | 32.6 | 29.2 | 30.7 | 31.8 | 24.0 | |
| Wheat | 33.2 | 30.6 | 25.2 | 31.8 | 21.6 | |
| Total (Rice & Wheat) |
65.8 | 59.8 | 55.9 | 63.6 | 45.6 | |
| Source: DFPD, M/o Consumer Affairs and Public Distribution. | ||||||
| Table 6: Stocks of Food Grains (Million Tonnes) | ||
| Crops | January 1, 2016 | January 1, 2017 |
| 1.Rice | 12.7 | 13.5 |
| 2.Unmilled Paddy# | 19.9 | 24.2 |
| 3.Converted Unmilled Paddy in terms of Rice |
13.3 | 16.2 |
| 4.Wheat | 23.8 | 13.7 |
| Total (Rice & Wheat)(1+3+4) | 49.8 | 43.4 |
| # Since September, 2013, FCI gives separate figures for rice and unmilled paddy lying with FCI & state agencies in terms of rice. | ||
| Table 7: Percentage Change in Index of Industrial Production | ||||
| Industry Group | April-Nov. 2015-16 | April-Nov. 2016-17 | Nov. 2015 | Nov. 2016 |
| General index | 3.8 | 0.4 | -3.4 | 5.7 |
| Mining | 2.1 | 0.3 | 1.7 | 3.9 |
| Manufacturing | 3.9 | -0.3 | -4.6 | 5.5 |
| Electricity | 4.6 | 5.0 | 0.7 | 8.9 |
| Basic goods | 3.9 | 4.1 | -0.5 | 4.7 |
| Capital goods | 4.7 | -18.9 | -24.4 | 15.0 |
| Intermediate goods | 2.0 | 3.4 | -1.5 | 2.7 |
| Consumer goods | 4.1 | 1.8 | 1.0 | 5.6 |
| Durables | 11.8 | 6.9 | 12.2 | 9.8 |
| Non-durables | -0.5 | -1.8 | -4.8 | 2.9 |
| Source: Central Statistics Office. | ||||
| Table 8: Production Growth (per cent) in Core Infrastructure-Supportive Industries | ||||
| Industry | April-Dec. 2015-16 |
April-Dec. 2016-17 |
December 2015 |
December 2016 |
| Coal | 4.5 | 2.0 | 5.3 | 4.4 |
| Crude oil | -0.8 | -3.2 | -4.1 | -0.8 |
| Manufacturing | 3.9 | -0.3 | -4.6 | 5.5 |
| Natural Gas | -2.8 | -3.3 | -6.1 | 0.0 |
| Refinery Products | 2.3 | 7.8 | 2.1 | 6.4 |
| Fertilizers | 11.3 | 3.4 | 13.5 | -4.7 |
| Steel | -1.6 | 8.9 | -3.1 | 14.9 |
| Cement | 2.6 | 2.8 | 4.1 | -8.7 |
| Electricity | 6.2 | 5.4 | 8.8 | 6.0 |
| Overall growth | 2.6 | 5.0 | 2.9 | 5.6 |
| Source: Office of the Economic Adviser, DIPP (Ministry of Commerce & Industry) | ||||
| Table 9: Broad Money: Sources | |||||
| (₹ Billion) | |||||
| Item | Outstanding as on | Y-O-Y Growth | |||
| 2016 | 2015 | 2016 | |||
| Mar. 31 | Dec. 23 | % | % | ||
| M3 | 1,16,176.2 | 120,449.5 | 10.9 | 6.5 | |
| Sources | |||||
| Net Bank Credit to Government | 32,384.8 | 38,129.9 | 5.5 | 17.1 | |
| Bank Credit to Commercial Sector | 78,030.7 | 78,938.3 | 9.5 | 4.9 | |
| Government's Currency Liabilities to the Public | 219.1 | 232.7 | 12.4 | 9.2 | |
| Banking Sector's Net Non-Monetary Liabilities | 19,795.6 | 22,794.6 | 7.0 | 18.4 | |
| Source: Reserve Bank of India | |||||
| Table 8: Production Growth (per cent) in Core Infrastructure-Supportive Industries | ||||
| Industry | April-Dec. 2015-16 |
April-Dec. 2016-17 |
December 2015 |
December 2016 |
| Coal | 4.5 | 2.0 | 5.3 | 4.4 |
| Crude oil | -0.8 | -3.2 | -4.1 | -0.8 |
| Manufacturing | 3.9 | -0.3 | -4.6 | 5.5 |
| Natural Gas | -2.8 | -3.3 | -6.1 | 0.0 |
| Refinery Products | 2.3 | 7.8 | 2.1 | 6.4 |
| Fertilizers | 11.3 | 3.4 | 13.5 | -4.7 |
| Steel | -1.6 | 8.9 | -3.1 | 14.9 |
| Cement | 2.6 | 2.8 | 4.1 | -8.7 |
| Electricity | 6.2 | 5.4 | 8.8 | 6.0 |
| Overall growth | 2.6 | 5.0 | 2.9 | 5.6 |
| Source: Office of the Economic Adviser, DIPP (Ministry of Commerce & Industry) | ||||
| Table 10 : Merchandise Exports and Imports (in US$ million) | |||||||
| Item | 2015-16 | 2015 | 2016 | % Change | 2015-16 | 2016-17 | % Change |
| December | (April-December) | ||||||
| Exports | 262290 | 22593 | 23885 | 5.7 | 197334 | 198808 | 0.8 |
| Imports | 381007 | 34096 | 34254 | 0.5 | 297411 | 275356 | -7.4 |
| Oil Imports | 82944 | 6671 | 7645 | 14.6 | 68267 | 60922 | -10.8 |
| Non-Oil Imports |
298062 | 27426 | 26609 | -3.0 | 229143 | 214434 | -6.4 |
| Trade Balance |
-118716 | -11503 | -10369 | - | -100077 | -76548 | - |
| Source: Provisional data as per the Press Note of the Ministry of Commerce and Industry | |||||||
| Table 11: Foreign Exchange Reserves (in Billion) | ||||
| End of Financial Year | Foreign Exchange Reserves | Variation | ||
| (Rupees ) | (US Dollar) | (Rupees ) | (US Dollar ) | |
| At the end of year | (Variation over last year) | |||
| 2012-13 | 15884 | 292.0 | 823 | -2.4 |
| 2013-14 | 18284 | 304.2 | 2400 | 12.2 |
| 2014-15 | 21376 | 341.6 | 3093 | 37.4 |
| 2015-16 | 23787 | 360.2 | 2411 | 18.6 |
| At the end of month | (Variation over last month) | |||
| April-2015 | 22110 | 351.9 | 733 | 10.2 |
| May-2015 | 22437 | 352.5 | 328 | 0.6 |
| June-2015 | 22660 | 356.0 | 328 | 3.5 |
| July-2015 | 22580 | 353.5 | -80 | -2.5 |
| August-2015 | 23199 | 351.4 | 619 | 2.1 |
| September -2015 | 22940 | 350.3 | -259 | 1.1 |
| October-2015 | 23025 | 354.2 | 85 | 3.9 |
| November-2015 | 23285 | 350.2 | 260 | -3.9 |
| December 2015 | 23135 | 350.4 | -150 | 0.1 |
| January 2016 | 23586 | 349.6 | 370 | -2.4 |
| February 2016 | 23744 | 348.4 | 158 | -1.2 |
| March 2016 | 23787 | 360.2 | 44 | 11.8 |
| April 2016 | 24040 | 363.0 | 253 | 2.9 |
| May 2016 | 24174 | 361.6 | 134 | -1.4 |
| June 2016 | 24442 | 363.5 | 268 | 1.9 |
| July 2016 | 24446 | 366.5 | 4 | 3.0 |
| August 2016 | 24448 | 366.8 | 2 | 0.3 |
| September 2016 | 24693 | 372.0 | 245 | 5.2 |
| October 2016 | 24413 | 366.2 | -280 | -5.8 |
| November 2016 | 24725 | 361.1 | 312 | -5.1 |
| December 2016* | 24483 | 360.3 | -242 | -0.8 |
| Source: RBI *: As on 30th December 2016 | ||||